Evaluating AQG tilt calibration measurements
The AQG has an integrated digital tiltmeter sensor to determine instrument verticality.
This sensor's tilt offset, the offset to true verticality, needs to be calibrated periodically by recording several short gravity measurements at different tilt angles.
analyze_aqg_tilt_calibration() is a procedure to process these datasets and perform a fit adjustment for the tilt offset.
This is demonstrated in the following.
The example data data/tilt_calibration.zip is a zip-compressed archive containing 12 folders of rawdata.
We can use files_in_path() to list all files within the archive as zipfile.Path instances.
Regular calibration
It is important that such a tilt meter calibration should be carried out on a regular basis. At a minimum it should be checked if the instrument was moved to a new location. There are several options to perform longer calibrations or just a short check.
from gravitools.utils import files_in_path
path_to_zipfile = "../data/tilt_calibration.zip"
all_files = files_in_path(path_to_zipfile)
for path in all_files:
    print(path.at)
20240126_092312/capture_20240126_092312.info
20240126_092312/capture_20240126_092312_0.csv
20240126_092312/capture_20240126_092312_raw_0.csv
20240126_095543/capture_20240126_095543_raw_0.csv
20240126_095543/capture_20240126_095543.info
20240126_095543/capture_20240126_095543_0.csv
20240126_081737/capture_20240126_081737_0.csv
20240126_081737/capture_20240126_081737.info
20240126_081737/capture_20240126_081737_raw_0.csv
20240126_102337/capture_20240126_102337_raw_0.csv
20240126_102337/capture_20240126_102337.info
20240126_102337/capture_20240126_102337_0.csv
20240126_093648/capture_20240126_093648.info
20240126_093648/capture_20240126_093648_0.csv
20240126_093648/capture_20240126_093648_raw_0.csv
20240126_084516/capture_20240126_084516_raw_0.csv
20240126_084516/capture_20240126_084516_0.csv
20240126_084516/capture_20240126_084516.info
20240126_103742/capture_20240126_103742.info
20240126_103742/capture_20240126_103742_raw_0.csv
20240126_103742/capture_20240126_103742_0.csv
20240126_085915/capture_20240126_085915_0.csv
20240126_085915/capture_20240126_085915.info
20240126_085915/capture_20240126_085915_raw_0.csv
20240126_090943/capture_20240126_090943.info
20240126_090943/capture_20240126_090943_raw_0.csv
20240126_090943/capture_20240126_090943_0.csv
20240126_083036/capture_20240126_083036.info
20240126_083036/capture_20240126_083036_0.csv
20240126_083036/capture_20240126_083036_raw_0.csv
20240126_101114/capture_20240126_101114_raw_0.csv
20240126_101114/capture_20240126_101114_0.csv
20240126_101114/capture_20240126_101114.info
20240126_080137/capture_20240126_080137.info
20240126_080137/capture_20240126_080137_raw_0.csv
20240126_080137/capture_20240126_080137_0.csv
analyze_aqg_tilt_calibration() expects a list of paths to raw datasets.
We can use is_aqg_info() to find the .info files of each dataset and create a list of their parent directories.
from gravitools.aqg.files import is_aqg_info
rawdata_folders = [path.parent for path in all_files if is_aqg_info(path)]
rawdata_folders
[Path('../data/tilt_calibration.zip', '20240126_092312/'),
 Path('../data/tilt_calibration.zip', '20240126_095543/'),
 Path('../data/tilt_calibration.zip', '20240126_081737/'),
 Path('../data/tilt_calibration.zip', '20240126_102337/'),
 Path('../data/tilt_calibration.zip', '20240126_093648/'),
 Path('../data/tilt_calibration.zip', '20240126_084516/'),
 Path('../data/tilt_calibration.zip', '20240126_103742/'),
 Path('../data/tilt_calibration.zip', '20240126_085915/'),
 Path('../data/tilt_calibration.zip', '20240126_090943/'),
 Path('../data/tilt_calibration.zip', '20240126_083036/'),
 Path('../data/tilt_calibration.zip', '20240126_101114/'),
 Path('../data/tilt_calibration.zip', '20240126_080137/')]
[ please note: reading EOP data this way is only necessary for the documentation (due to missing local file systems) ]
from gravitools.corrections import read_eop_data
eop_data = read_eop_data('../data/finals2000A.all.csv')
Call analyze_aqg_tilt_calibration() to read these datasets directly from the zip-archive, process them, and perform the tilt calibration analysis.
from gravitools.aqg.tilt import analyze_aqg_tilt_calibration

tilt_calibration = analyze_aqg_tilt_calibration(rawdata_folders)
tilt_calibration
<AQGTiltAnalysis: x = 53.2 ± 2.1 µrad, y = -50.0 ± 2.0 µrad (2024-01-26)>
The return object is of type AQGTiltAnalysis(). It contains the processed input datasets, ...
tilt_calibration.datasets
[<AQGDataset: 20240126_092312>,
 <AQGDataset: 20240126_095543>,
 <AQGDataset: 20240126_081737>,
 <AQGDataset: 20240126_102337>,
 <AQGDataset: 20240126_093648>,
 <AQGDataset: 20240126_084516>,
 <AQGDataset: 20240126_103742>,
 <AQGDataset: 20240126_085915>,
 <AQGDataset: 20240126_090943>,
 <AQGDataset: 20240126_083036>,
 <AQGDataset: 20240126_101114>,
 <AQGDataset: 20240126_080137>]
... the data points calculated from each dataset, ...
tilt_calibration.datapoints
| name | tilt_x | tilt_y | g | g_err | valid_drops | total_drops | tilt | g_fit | dg_residual | |
|---|---|---|---|---|---|---|---|---|---|---|
| 0 | 20240126_092312 | 0.000954 | -2.993693e-04 | 9.812627e+09 | 50.849362 | 1121 | 1152 | 0.000935 | 9.812627e+09 | 18.613588 |
| 1 | 20240126_095543 | 0.000002 | -1.000327e-03 | 9.812626e+09 | 48.555102 | 1301 | 1367 | 0.000952 | 9.812626e+09 | 28.892666 |
| 2 | 20240126_081737 | -0.000947 | 3.010346e-04 | 9.812625e+09 | 42.218485 | 953 | 1069 | 0.001060 | 9.812625e+09 | -17.165678 |
| 3 | 20240126_102337 | -0.000953 | 2.998778e-04 | 9.812625e+09 | 42.384151 | 892 | 956 | 0.001066 | 9.812625e+09 | -66.174479 |
| 4 | 20240126_093648 | 0.000598 | -8.016627e-04 | 9.812627e+09 | 33.768754 | 1503 | 1534 | 0.000928 | 9.812627e+09 | 6.673079 |
| 5 | 20240126_084516 | -0.000001 | 9.993161e-04 | 9.812625e+09 | 43.974306 | 1066 | 1222 | 0.001051 | 9.812625e+09 | 74.626623 |
| 6 | 20240126_103742 | 0.000006 | -6.904203e-06 | 9.812631e+09 | 28.754163 | 2641 | 3341 | 0.000064 | 9.812631e+09 | -0.863997 |
| 7 | 20240126_085915 | 0.000606 | 7.993125e-04 | 9.812626e+09 | 38.353578 | 656 | 755 | 0.001013 | 9.812626e+09 | -51.945227 |
| 8 | 20240126_090943 | 0.000950 | 3.009955e-04 | 9.812626e+09 | 45.427965 | 891 | 1012 | 0.000963 | 9.812626e+09 | 4.057146 |
| 9 | 20240126_083036 | -0.000602 | 7.987434e-04 | 9.812625e+09 | 37.201771 | 1204 | 1338 | 0.001073 | 9.812625e+09 | 51.031088 |
| 10 | 20240126_101114 | -0.000602 | -8.003346e-04 | 9.812626e+09 | 39.121450 | 786 | 885 | 0.000996 | 9.812626e+09 | 8.986578 |
| 11 | 20240126_080137 | 0.000001 | -9.982699e-07 | 9.812631e+09 | 43.854712 | 1156 | 1290 | 0.000072 | 9.812631e+09 | -51.326435 |
... and the tilt offset fit result.
tilt_calibration.result
TiltOffset(x=np.float64(5.3242042191424585e-05), y=np.float64(-4.995984434224595e-05), g=np.float64(9812630813.60726), u_x=np.float64(2.0862783469796138e-06), u_y=np.float64(2.0419623905558195e-06), u_g=np.float64(13.187450175618055))
str(tilt_calibration)
'x = 53.2 ± 2.1 µrad, y = -50.0 ± 2.0 µrad (2024-01-26)'
AQGTiltAnalysis also provides methods to visualize the different types of data:
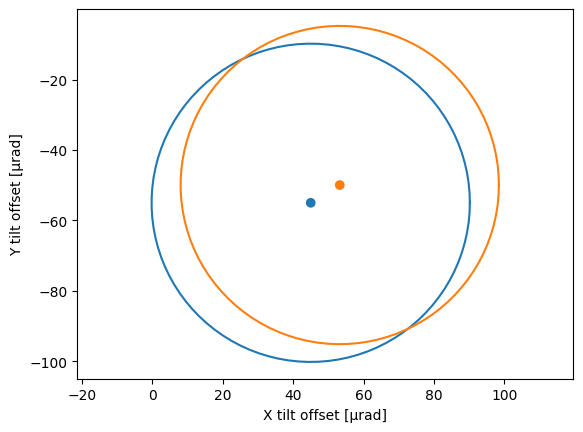
plot_tilt_offset() draws the tilt offset result as a single datapoint, along with a circle of 45 µrad radius as a visual reference for 10 nm/s² tilt correction effect.
This can be used to compare multiple tilt calibration results.
import matplotlib.pyplot as plt
from gravitools.aqg.tilt import TiltOffset

previous_tilt_offset = TiltOffset(45e-6, -55e-6)

plt.figure()
previous_tilt_offset.plot()
tilt_calibration.plot_tilt_offset()
plt.show()
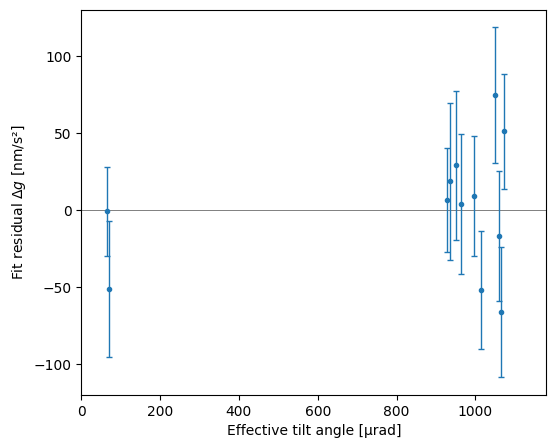
plot_residuals() creates a plot of the fit residuals against the effective tilt angle.
tilt_calibration.plot_residuals()

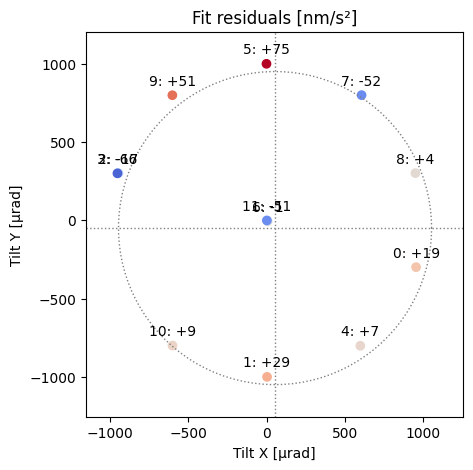
plot_tilt_distribution() creates a plot of the data points' tilt angle distribution.
Numbers next to the datapoints show the sequence of measurement and respective fit residual.
The residual is also indicated by a colormap.
Dotted lines mark the calculated tilt offset (i. e. verticality) and a circle of 1 mrad tilt.
tilt_calibration.plot_tilt_distribution()

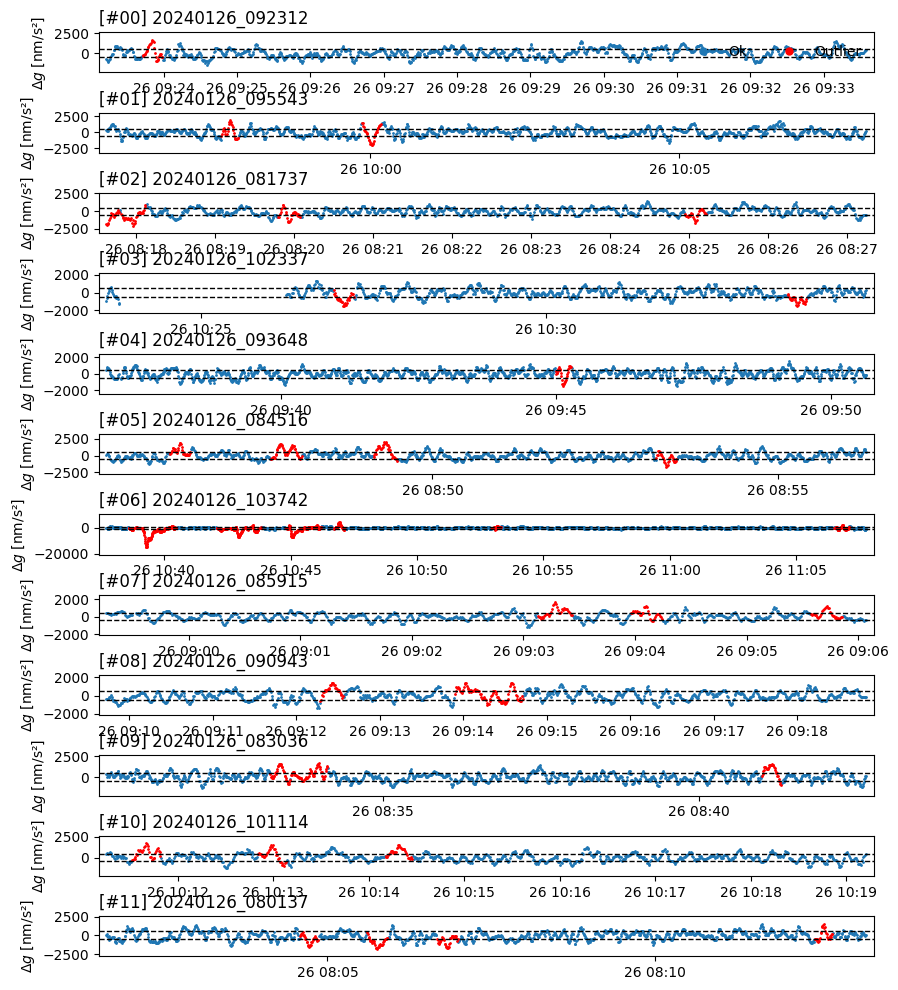
plot_datasets() creates a stacked plot of the full gravity signal of all datasets, highlighting detected outliers.
This provides a quick overview to assess the quality of the data and outlier detection.
tilt_calibration.plot_datasets()

PDF report
A PDF-report for the tilt calibration analyses can be generated.
tilt_calibration.save_report("../data/AQG_tiltCarlibration_report.pdf")
<Figure size 1360x600 with 0 Axes>


<Figure size 1360x600 with 0 Axes>


<Figure size 1360x600 with 0 Axes>