AQG dashboard: processing
The main dashboard window provides 3 panels: Static and dynamic parameters of a dataset, data visuzalization and a protocol form. Drop-down menus on the top of the window give access to file-related operations, calibrations and reports.
Besides protocol and reporting, described in a seperate section of the documentation, the following can be done with the dashboard:
- Loading and processing of regular AQG data
- Evaluation of tilt meter calibration measurements
- Evaluation of Coriolis effect analysis measurements
- Processing of collimator calibration scans
Regular data processing
The main data processing consists of loading a dataset and combine it, optionally, with a config file. The plots in the visualization part of the main window will then automatically show the data of the loaded dataset and the static and dynamically parameters will be shown in the vertical table on the left.
Loading a dataset
There are several possibilities how datasets can be loaded: (1) raw dataset records, (2) compressed archive of dataset(s) and (3) already processed and stored dataset (netCDF-file).
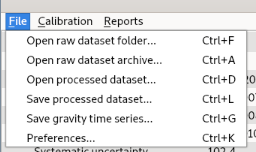
These options are all shown in the File menu.
Preferences for the dashboard
A dialog for setting preferences can be opened via File > Preferences. Several options are provided, explained in detail below:
- config-file (=load a yaml config file)
- auto-reload
- refresh interval
- transfer height
- Threshold Allan value
- Sensivitiy calculation Tau values
- IP of sensor head
Default values
On every start of the dashboard, values in the preferences dialog are set to their respective default values.
Config file
Using a config file is the only way to "interact" with the data processing in the dashboard. It is not mandatory and if not used, processing will occur with gravitools standard values (e.g. for outlier correction).
Format and available keys and parameters in config files are explained in detail in this section.
Note
If you load a config file together with a dataset. You can open the config file and modify parameters.
If auto-reload is enabled in the dashboard, these new parameter values will be considered for processing from the next reload onwards.
Auto-reload of data
Enables automatic reloading of the data with the chosen refresh interval. This is particullary useful for looking at data of ongoing measurements.
Long datasets
Please be aware that up to now the dashboard is not designed to quickly reprocess long datasets.
This will be improved in the future.
For this reason, auto-reloading is disabled by default on dashboard startup.
It can either be enabled in the preferences dialod or via the button on the right window panel: Reload data: on.
Transfer height
By default, the reference height for final absolute gravity values in gravitools is 0.00 m (the marker or the pillar surface). The displayed absolute gravity value in the middle top part of the window, related to this and also shows the reference height. If you want to transfer to another height, use this option.
Threshold Allan value
The threshold allan value was introduced as a potential good canditate to statistically desribe the uncertainty of a measurement.
This options sets the tau-value at which the gravity value is extracted from the Allan Deviation.
You can find more information in Reich et. al. (2026).
Sensitivity calculation
Calculating the sensitivity of a measured dataset, usually the linear part of the Allan Deviation is used, because of noise being solely white noise. In order to estimate this linear part, standard values can be used (20s and 200s, as put here for default values). gravitools however offers an alternative "brute-force"-approach of identifying this linear part. A detailed description of this can be found here.
If the latter should be used in the dashboard, just leave both fields blank.
Computational resources
Be aware that this is computationally more expensive and long datasets in combination with auto-reload and this sensitivity setting might crash the dashboard.
IP of sensor head
This value can change from instrument to instrument. It has to be set to the IP of the microcontroller in the sensor head and is used to retrieve some live information in the instrument status window of the dashboard.
Screenshot of the preference dialog
Visualization of data
The data plots shown in the middle part consist of:
- gravity time series incl. outlier detection
- Allan deviation (of outlier corrected data)
- Atom number
- X and Y tilt values
- System component temperatures
In the gravity signal plot, outliers are highlighted in red. This can be configured the outlier detection parameters in your processing configuration file. See detect_outliers() for parameters, options and default values.
Controlling plots
Use the mouse to pan and zoom a plot's view range. A double-click will reset the view range.
Saving data
There are 2 options how processed data can be saved.
They can both be found in the File menu.
1) With Save processed dataset a processed dataset will be stored equivalent to calling the method dataset.to_nc(). A folder can be selected for the output location.
2) With Save gravity time serires only the time stamp and the processed gravity value will be exported as .csv-file.
Measurement report
A report of a processed measurement can be created via Reports > Save measurement report.
Tilt calibration
To analyze datasets collected for a tilt meter (re-) calibration, the option Calibration > Tilt calibration can be used. In the best case, all related measurements are stored as subfolders in one main folder.
On selecting this option from the drop-down menu, this main folder has to be selected. After the anyslsis, a new window will open showing the results of the analysis.
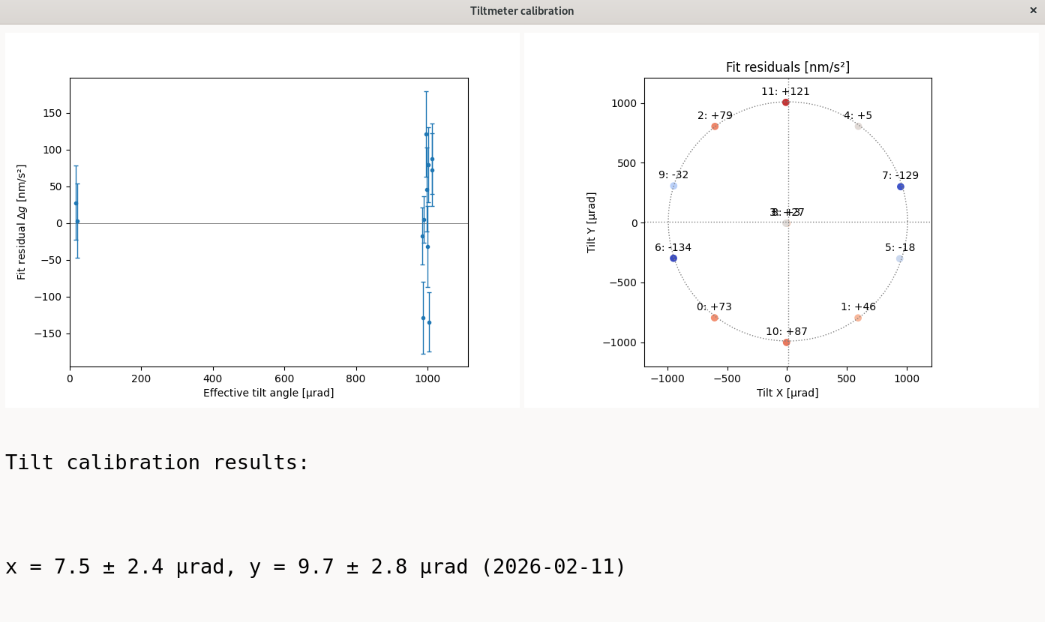
A report can be created using afterwards via Reports > Save tilt calibration report.
Collimator calibration
Sometimes it can happen that the automatic collimator calibration within the AQG GUI cannot find a maximum.
The data of the scan is nevertheless stored in a .csv-file, usually at in this directory: .aqg/data/collimator_scans.
When choosing the desired file via Calibration > Collimator calibration, an alternative routine is exectuted, providing more contrast in the plot to identify the maximum.
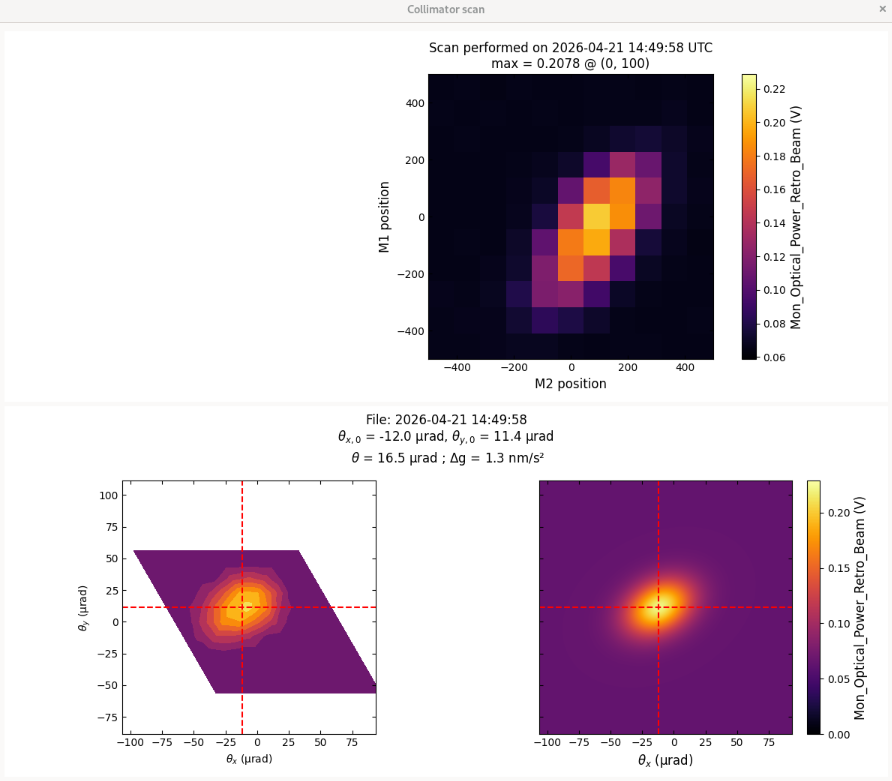
Warning
This does not help you to set new motor positions for the collimator but is a quick way of looking where the motor positions are and what this influence in gravity values would be (without changing any settings).
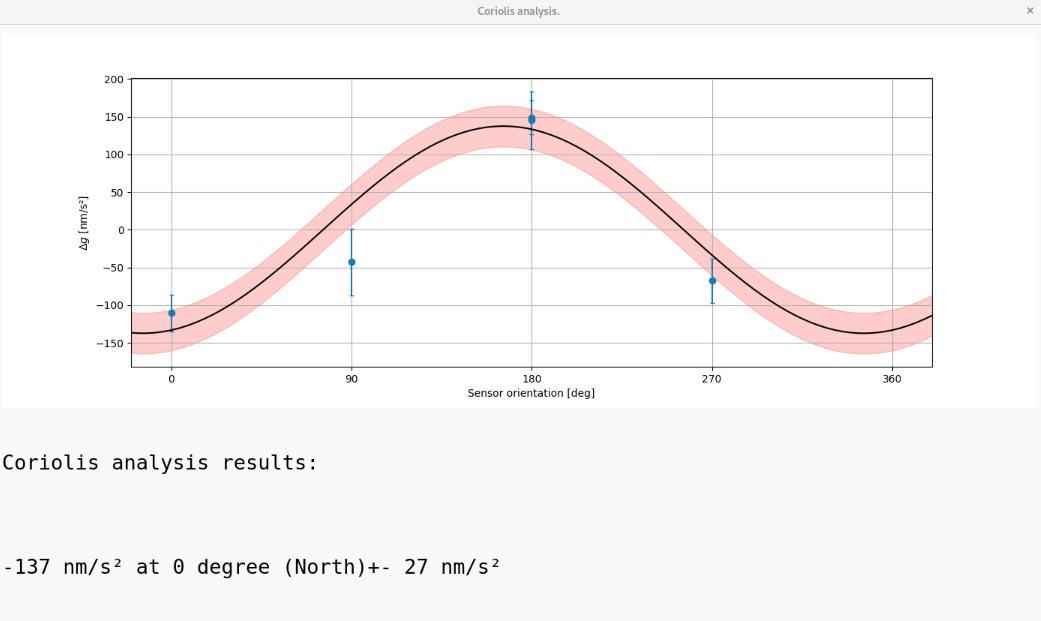
Coriolis analysis
To analyze datasets collected for an evaluation of the Coriolis effect, the option Calibration > Coriolis analysis can be used. In the best case, all related measurements are stored as subfolders in one main folder.
On selecting this option from the drop-down menu, this main folder has to be selected. After the anyslsis, a new window will open showing the results of the analysis.
Config file sometimes necessary
Especially for data from older AQG software versions, it is necessary to load a config file (in the preferences dialog) before processing Coriolis datasets. This has the reason that the orientation is the critical part of the Coriolis analysis and it is NOT stored consistenly in older datasets. Even for newer datasets it could be handy for reproducibility but if used properly during data recording, Coriolis data processing should then work without config files.
A report can be created using afterwards via Reports > Save coriolis measurement report.