AQG dashboard: overview
The AQG dashboard is a graphical user application to process and visualize AQG datasets. It is primarily intended to run on the AQG control laptop and expand upon the official AQG GUI control software by providing additional options and features. It intents to enhance the operator's ability to monitor data quality during ongoing measurements, especially for field measurements. The dashboard can also be used to process entire datasets but has a limited set of processing options (via config files), compared to script-based usage of gravitools.
Installation and running the dashboard
To use the dashboard, gravitools has to be installed with the dashboard dependencies:
    $ pip install gravitools[dashboard]

    # or

    $ conda install gravitools-dashboard --channel conda-forge
Run the dashboard with:
$ gt-aqg-dash
Features:
- Open running or completed AQG raw datasets
- Visualize instrument parameters
- Apply processing configurations from a YAML config file
- Provide a standardized measurement protocol for additional documentation
- Analyse tilt calibration, Coriolis and collimator calibration datasets
- Enhanced maintenance display options
- Generate reports:
- measurement
- tilt calibration
- coriolis effect evaluation
- protocol
Computational limitations
The application is intended for short measuremts up to approx. 1 million drops
(1 week). For longer time series, the interface performance may be insufficient.
This can be controlled via the reload interval option.
Structure
The main dashboard consists one window with three panels:
- Data, parameters and metadata from loaded AQG datasets
- Plots
- Measurement protocol
There are in the upper most part 3 drop-down items listed:
- File
- Calibration
- Reports
Some of the offered options open a second window, some are displayed in the main window.
Please see the dedicated documentation items for the respective usages.
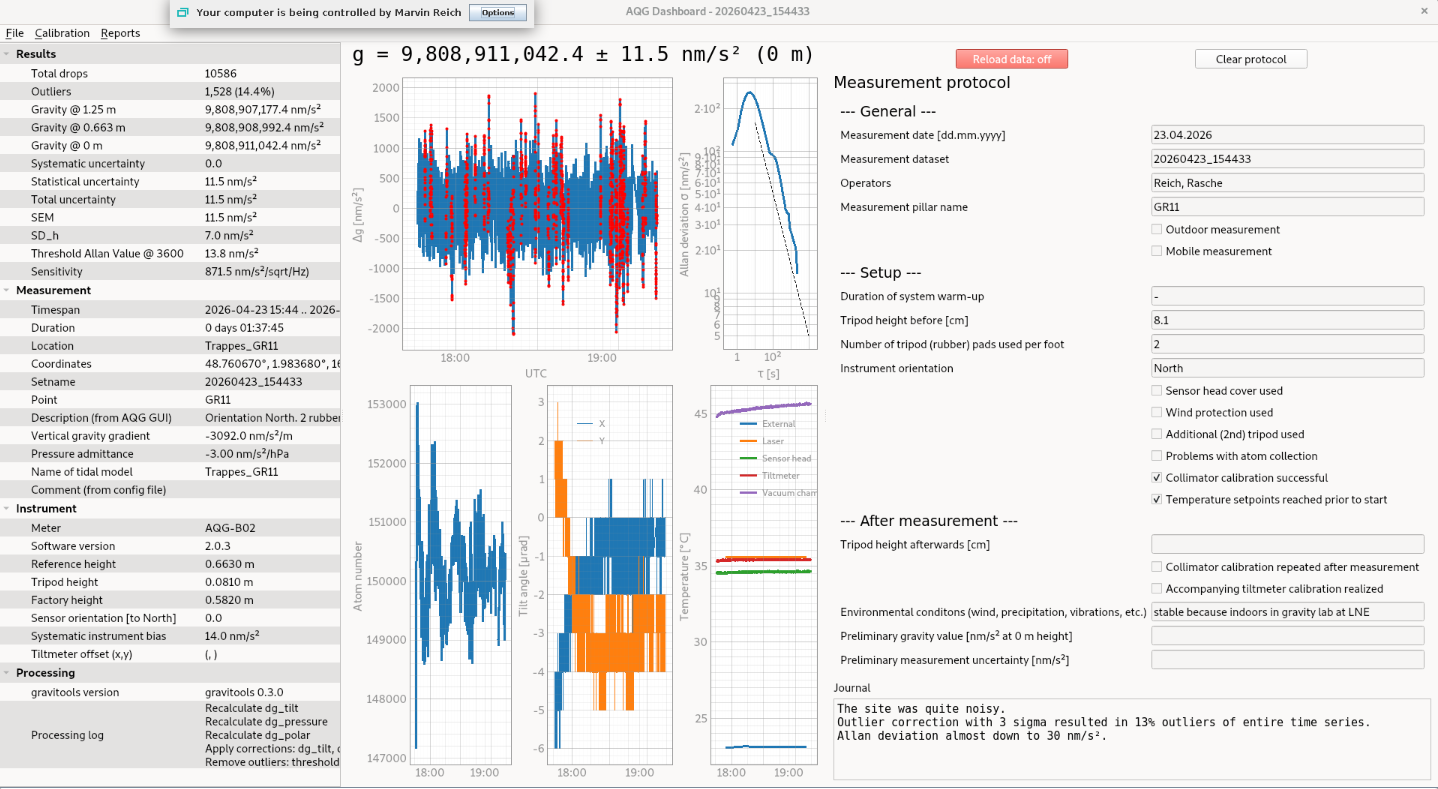
Overview of main window
Launching dashboard via icon (on Linux)
If you want to start the gravitools dashboard on the AQG laptop or any system with clicking an icon, just as starting any other application, this is what you need:
- script to start dashboard (especially, if inside a virtual environment)
- logo to display
- linux-application start file (refering to the above and placed in the correct location)
Note
You can find examples to be modified in the gravitools git-repository in data/dashboard_application.
Warning
This example works for Debian Linux. You might need to adjust the prodecure for other operating systems, including other Linux distributions.
script to start dashboard
This file (1) loads the a virtual environment and (2) starts the dashboard.
In this example, the virtual environment was created (and is loaded) via pyenv, but it also works with the python-integrated venv-command.
Please adjust the script, if desired.
Content of dashboard_startup_script:
#!/bin/bash
echo "activating virtual environment"
. /home/user/.pyenv/versions/<name_of_your_environment>/bin/activate
echo "starting AQG dashboard.."
gt-aqg-dash
echo "dashboard started. Please load some data."
This file, e.g. AQGdashboard.desktop, has to be placed in /usr/share/applications/ in order to make it accessible to all computer users.
[Desktop Entry]
Name=AQG  Dashboard
Comment=Analysis of AQG measurement via GUI application
Icon=<path/to/app_logo.png>
Type=Application
Categories=GTK;GNOME;Utility;
Exec=<path/to/dashboard_startup_script>
Terminal=false