AQG dashboard: instrument status
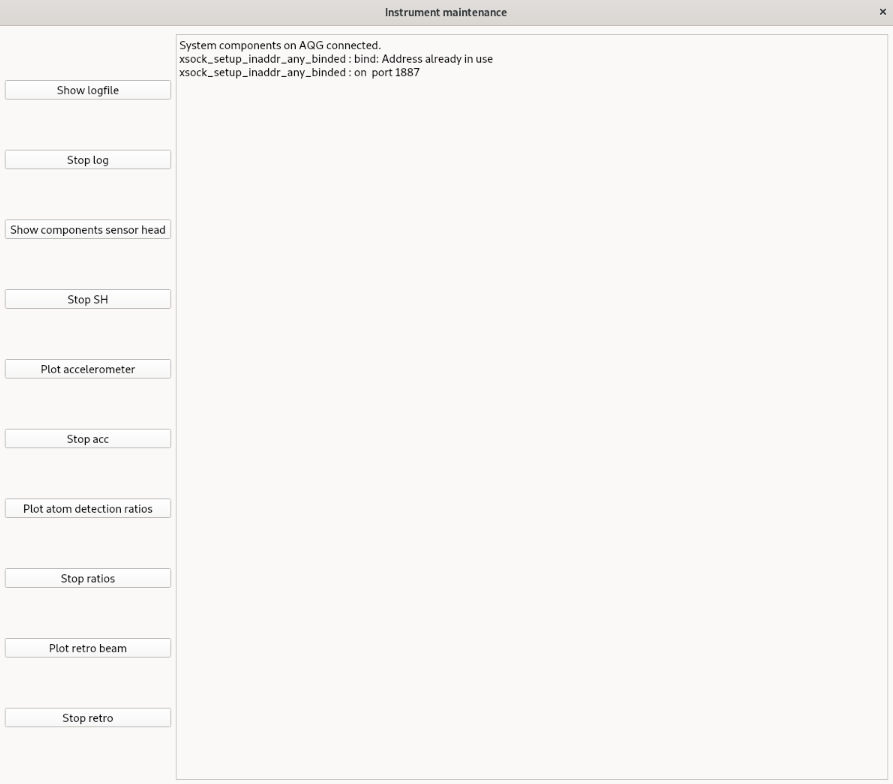
To access opptions for instrument status and maintenance / debugging, select in the upper bar Calibration > Instrument maintenance. This will open a new window as shown below.
Connection to the instrument
On window opening, a check is performed wether the dashboard is run on the AQG laptop and a connection to the instrument can be established. All options in this window will only work if the dashboad is run on the AGG laptop.
Features:
- Show the instrument log file (located at the AQG laptop usually at
.aqg) - Show real-time components from a micro-controller in the AQG sensorhead
- Plot z-component of the accelerometer
- Plot atom detection ratios
- Plot the retro beam
The desired button has to be clicked to initiate the respective action. Buttons toggle this action.